Unsupervised learning is like exploring a new city without a map—it’s a machine learning method where models learn from unlabeled data to find patterns or structures without specific guidance or predefined outcomes. It involves identifying hidden relationships, structures, or clusters within the data, allowing the model to discover insights, group similar data points, or reduce the dimensionality of complex datasets without explicit labels or supervision. The two most fundamental techniques, clustering and dimensionality reduction, will be explaind.

This image was created asking a popular AI-image generator to create
“Unsupervised Learning”
Clustering: K-means, hierarchical clustering
Clustering is like organizing a messy room into different piles based on similarity. Here are simple explanations for K-means and hierarchical clustering:
- K-means Clustering: Imagine you have a bunch of colored balls and you want to group them by color. K-means clustering is like trying to find the best way to group these balls into a certain number of piles. You start by guessing where these piles should be and then move them around until each ball ends up in the pile with the most similar colors. It keeps adjusting the piles until the balls in each pile are as similar as possible.
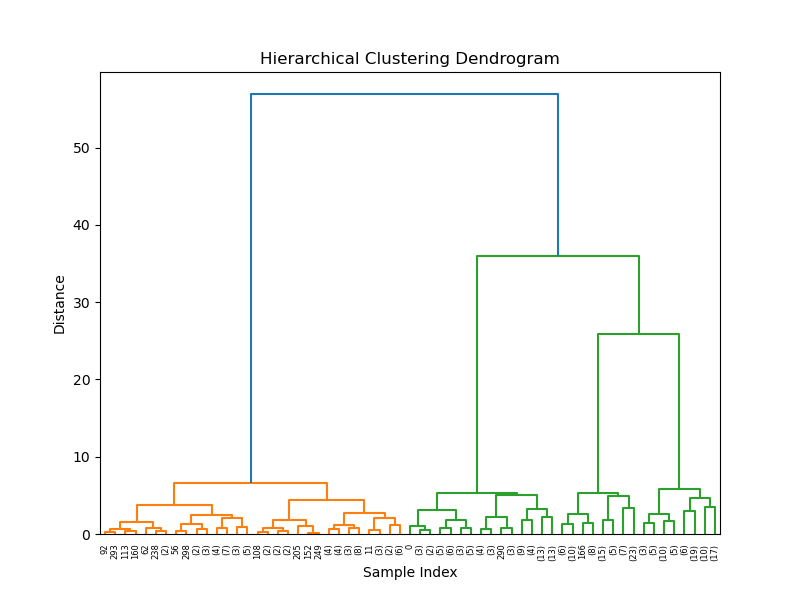
- Hierarchical Clustering: Think of this as creating a family tree but for your colored balls. You start by considering each ball as its own cluster. Then, you pair the most similar balls or clusters together to create a bigger cluster. You keep doing this, joining more similar things together at each step until all the balls belong to one giant family tree of clusters.
This is an example for hierarchical clustering in Python.
import matplotlib.pyplot as plt
import numpy as np
from sklearn.datasets import make_blobs
from sklearn.cluster import AgglomerativeClustering
from scipy.cluster.hierarchy import dendrogram

# Generating sample data
X, _ = make_blobs(n_samples=300, centers=4, cluster_std=0.6, random_state=0)

# Perform hierarchical clustering
clustering = AgglomerativeClustering(n_clusters=None, distance_threshold=0).fit(X)

# Plot dendrogram
def plot_dendrogram(model, **kwargs):
    counts = np.zeros(model.children_.shape[0])
    n_samples = len(model.labels_)
    for i, merge in enumerate(model.children_):
        current_count = 0
        for child_idx in merge:
            if child_idx < n_samples:
                current_count += 1
            else:
                current_count += counts[child_idx - n_samples]
        counts[i] = current_count

    linkage_matrix = np.column_stack([model.children_, model.distances_, counts]).astype(float)
    dendrogram(linkage_matrix, **kwargs)

plt.figure(figsize=(8, 6))
plt.title('Hierarchical Clustering Dendrogram')
plot_dendrogram(clustering, truncate_mode='level', p=5)
plt.xlabel('Sample Index')
plt.ylabel('Distance')
plt.show()
So, K-means focuses on finding distinct groups by repeatedly adjusting where those groups are, while hierarchical clustering builds a hierarchy of clusters by gradually merging similar ones together. Both methods help organize data into meaningful groups based on their similarities.
Dimensionality reduction: Principal Component Analysis (PCA), t-SNE
Dimensionality reduction is like taking a big, crowded map and turning it into a simpler version that still keeps the important parts. Let’s explore PCA and t-SNE:
- Principal Component Analysis (PCA): Imagine you have a lot of different types of fruits and you want to describe them using just a few characteristics, like color, size, and sweetness. PCA helps by finding the most essential features that describe these fruits the best. It’s like figuring out the main directions on the map where most of the action is happening and focusing on those directions to represent the data.
- t-SNE (t-Distributed Stochastic Neighbor Embedding): Now, picture you have a bunch of different shapes scattered on a piece of paper, and you want to group similar shapes closer together and separate different shapes. t-SNE is like squishing and arranging these shapes on a new piece of paper so that similar shapes end up near each other and different shapes stay farther apart. It’s a bit like creating a map where similar things are close and dissimilar things are far away from each other.
This is an example of t-SNE in Python.
import matplotlib.pyplot as plt
from sklearn.datasets import load_digits
from sklearn.manifold import TSNE

# Load a dataset (for example, the digits dataset)
digits = load_digits()
X = digits.data
y = digits.target

# Apply t-SNE for dimensionality reduction (reduce to 2 dimensions)
tsne = TSNE(n_components=2, random_state=42)
X_tsne = tsne.fit_transform(X)

# Visualize the t-SNE representation
plt.figure(figsize=(8, 6))
plt.scatter(X_tsne[:, 0], X_tsne[:, 1], c=y, cmap='viridis')
plt.title('t-SNE Visualization of Digits Dataset')
plt.colorbar(label='Digit Label', ticks=range(10))
plt.xlabel('t-SNE Component 1')
plt.ylabel('t-SNE Component 2')
plt.show()
The main goal is to simplify complex data without losing too much important information. It’s like summarizing a big book into a shorter version that still captures the main story. By reducing dimensions, we can visualize and understand data better, remove noise, speed up computation, and sometimes improve the performance of machine learning models by focusing on the most important aspects of the data.
Unsupervised learning techniques are crucial
Unsupervised learning techniques are instrumental in uncovering insights, simplifying complex datasets, and preparing data for downstream tasks, contributing significantly to various fields like data analysis, pattern recognition, and anomaly detection:
- Exploratory Analysis: They help explore and understand complex datasets by finding hidden patterns, structures, or relationships within the data without needing labeled examples.
- Feature Extraction and Dimensionality Reduction: Unsupervised techniques like PCA or clustering aid in reducing the number of features or variables in a dataset while retaining important information, making it easier to visualize and analyze.
- Anomaly Detection and Outlier Identification: These techniques can detect unusual patterns or anomalies in data, which is valuable in fraud detection, identifying rare events, or finding irregularities in large datasets.
- Data Preprocessing and Clustering: Unsupervised methods play a vital role in preparing data for further analysis or modeling, including data normalization, scaling, and grouping similar data points into clusters.
